Blinded by Averages – Why Hitting Your Targets Isn’t Good Enough

Most organizations measure their performance using averages against standard KPIs. The result? Typically, targets are met through the superior efforts of approximately one third of a call centre’s agents. An equal number miss the mark within an acceptable range. Most critically, up to a third again are so far from the target that they drag performance way down. Averages effectively hide the degree of this drag and allow targets to be set much lower than they could be. This in turn lowers everyone’s performance because it removes incentive.
Wouldn’t you rather have every agent operating more like the top third – and be able to set and reach higher targets as a result?
Today’s contact centres hire great people, provide induction training, and set up coaching programs, dashboards and reporting systems to track how they’re doing. All this effort and investment should produce great results. But the fact is, results will always fall well short of what they could be, if the reported data doesn’t tell the true story of your agents’ performance.
To get the true story, you have to look beyond averages to see the variance in individual performance. Only by analyzing the dispersion of these scores against target can you see the gaps, and create coaching programs that truly capture best agents’ practices and teach them to those who aren’t as strong in their performance.
How Bad Can it Be?
Usually much worse than an organization expects. When we examine individual performance, we find that agents out of incubation bays, doing like work, are always 60% to 200% in their variance of productivity performance. That means some agents are producing twice the output of others. Variance at this level is flat out too costly. Anything greater that 50% of agents doing like work should be the Maximum Allowable Variance (MAV). Practices, processes and technologies need to be in place to ensure you are not leaving more on the table. In the case of a 100 seat centre, even 20-30% means $800 to $1.2M that’s coming straight off your bottom line.
Let’s look at some typical examples of agent variance around commonly used KPIs. These are all based on real results from call centres known to excel in their fields.
Sales
While many factors can influence individual sales performance, it’s frequently the case that results vary by up to 1000% between best and worst agents – and that’s just too big a gap for a skill that can be taught and learned.
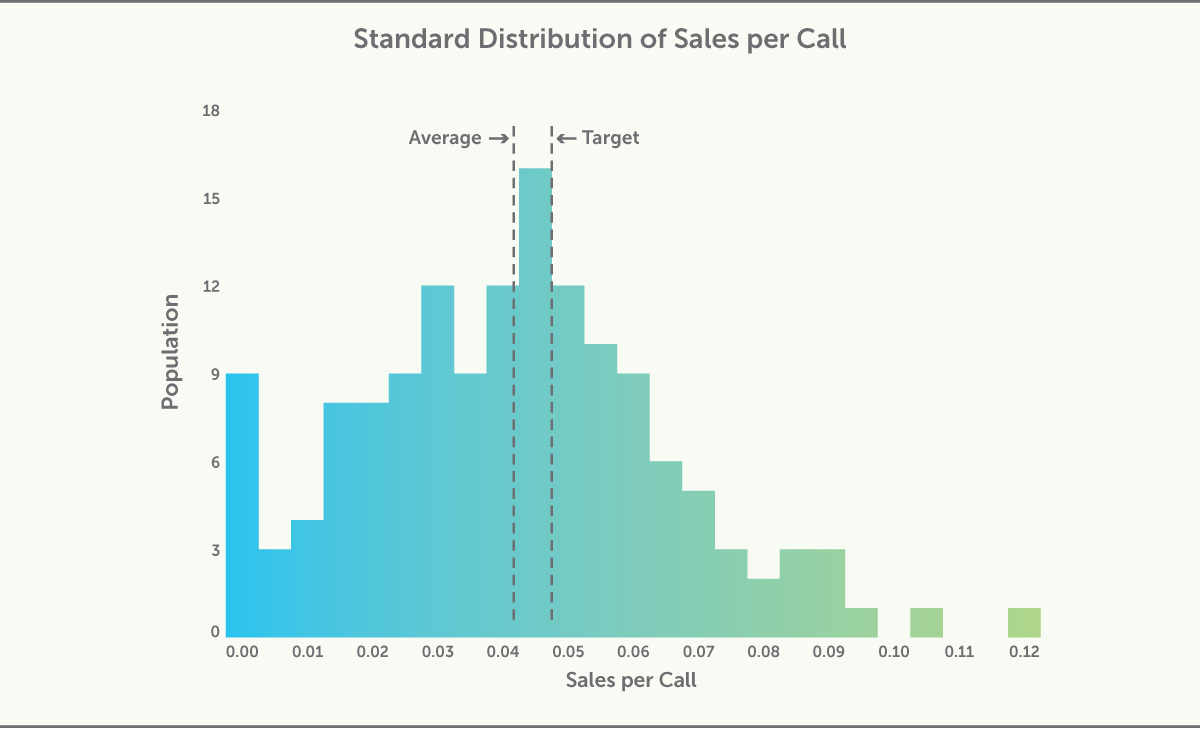
This sample chart demonstrates that some agents are leading the pack by a huge margin. Clearly, their approach needs to be captured and taught to other agents. Conversely, the number of agents contributing almost nothing to the bottom line is astoundingly high. This kind of sales variance is very typical.
The resulting average, being close to target, gives the illusion that this is a high performing team. The reality? It’s a highly varied team whose total performance could be vastly improved through focused coaching.
Coaching programs that actively look for performance gaps of this nature and address the specific skill deficits of those who aren’t making target are far more likely to succeed.
Schedule Compliance
While this KPI tends to cluster closer to target, as a basic indicator of whether an agent is even at their desk it should be even tighter.
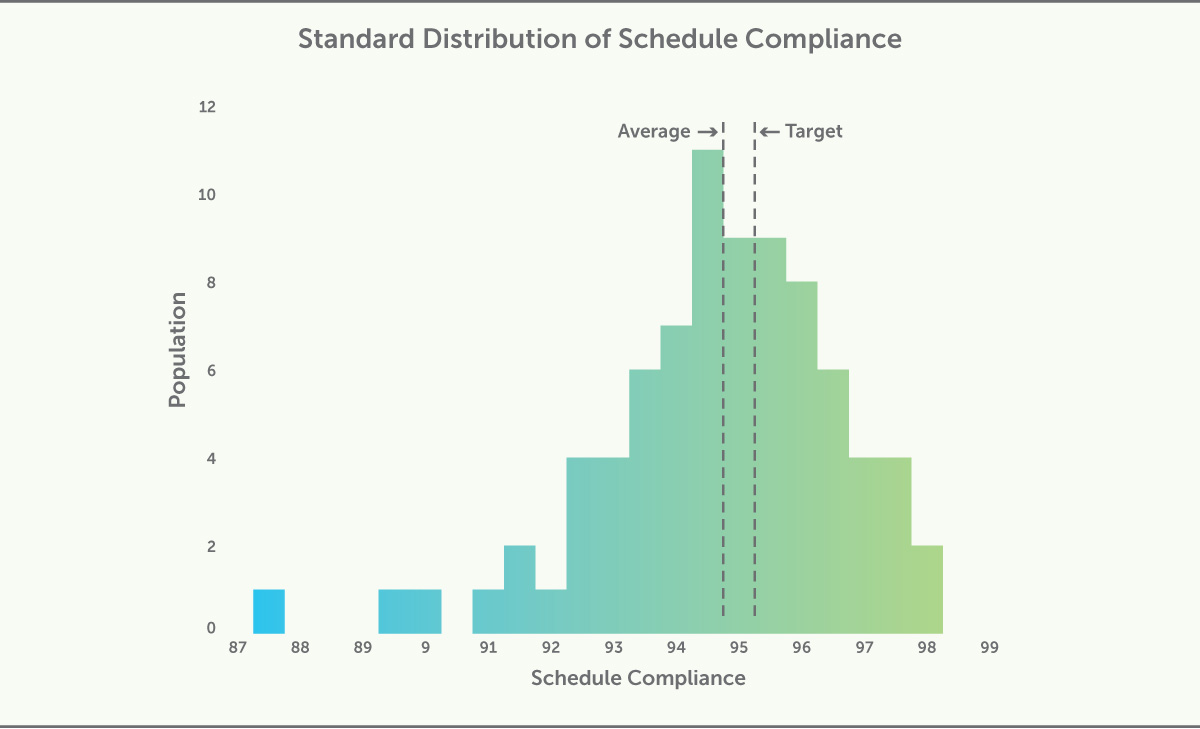
The agents who are well off target tend to be hidden from view when looking at averages alone; in this example, average compliance is very close to target but a significant number of much less compliant agents are preventing the team from hitting the goal. Agents who don’t show up 8-12% of the time, as is the case here, can’t possibly contribute well to other KPI targets, thus affecting all areas of performance.
Scorecard alerts that flag this behavior to managers allow the issue to be resolved before it becomes an ingrained habit.
Average Handle Time
As with sales performance, this is a KPI that typically generates a huge variance between agents. Understanding the breadth of scores on this dimension, as well as how the scores correlate to quality or sales in an organization, is critical to setting KPIs that, together, truly contribute to overall organization goals.
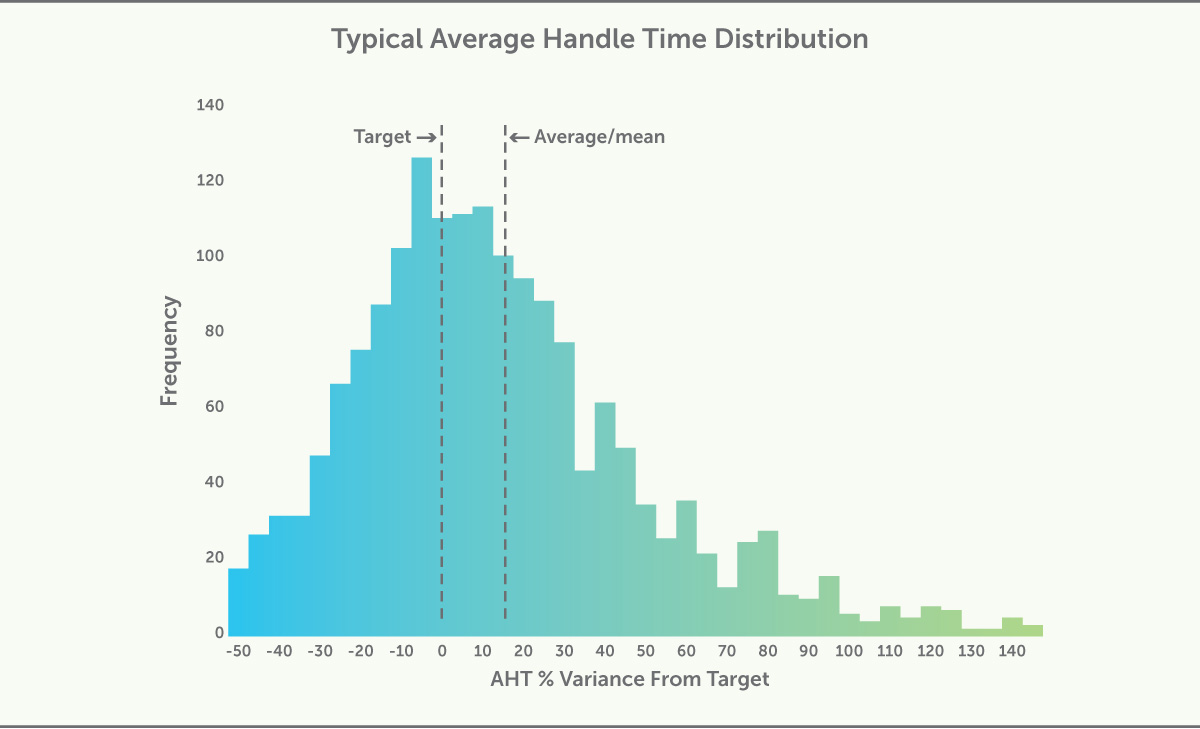
The AHT group average is heavily influenced by the 30% or so who are over-performing. Are these quick agents also hitting the required FCR, Quality or Sales goals? If so, how are they managing it? And what could the 30% who take three times as long – or more – be doing to make their calls more efficient?
Putting It All Together
By looking at every KPI in this way and correlating the results, organizations get a much clearer picture of what is contributing to, and detracting from, success. The winning ways of top agents can be analyzed and taught to others, the specific weaknesses of less adept agents can be addressed and fixed, the effects of one KPI achievement on another KPI can be fully understood. Only by going beyond averages in this way can the true performance story be seen and action taken.
From this base of knowledge, active coaching programs with appropriate scorecard and feedback systems can be put in place to ensure every agent performs to the best of their ability.